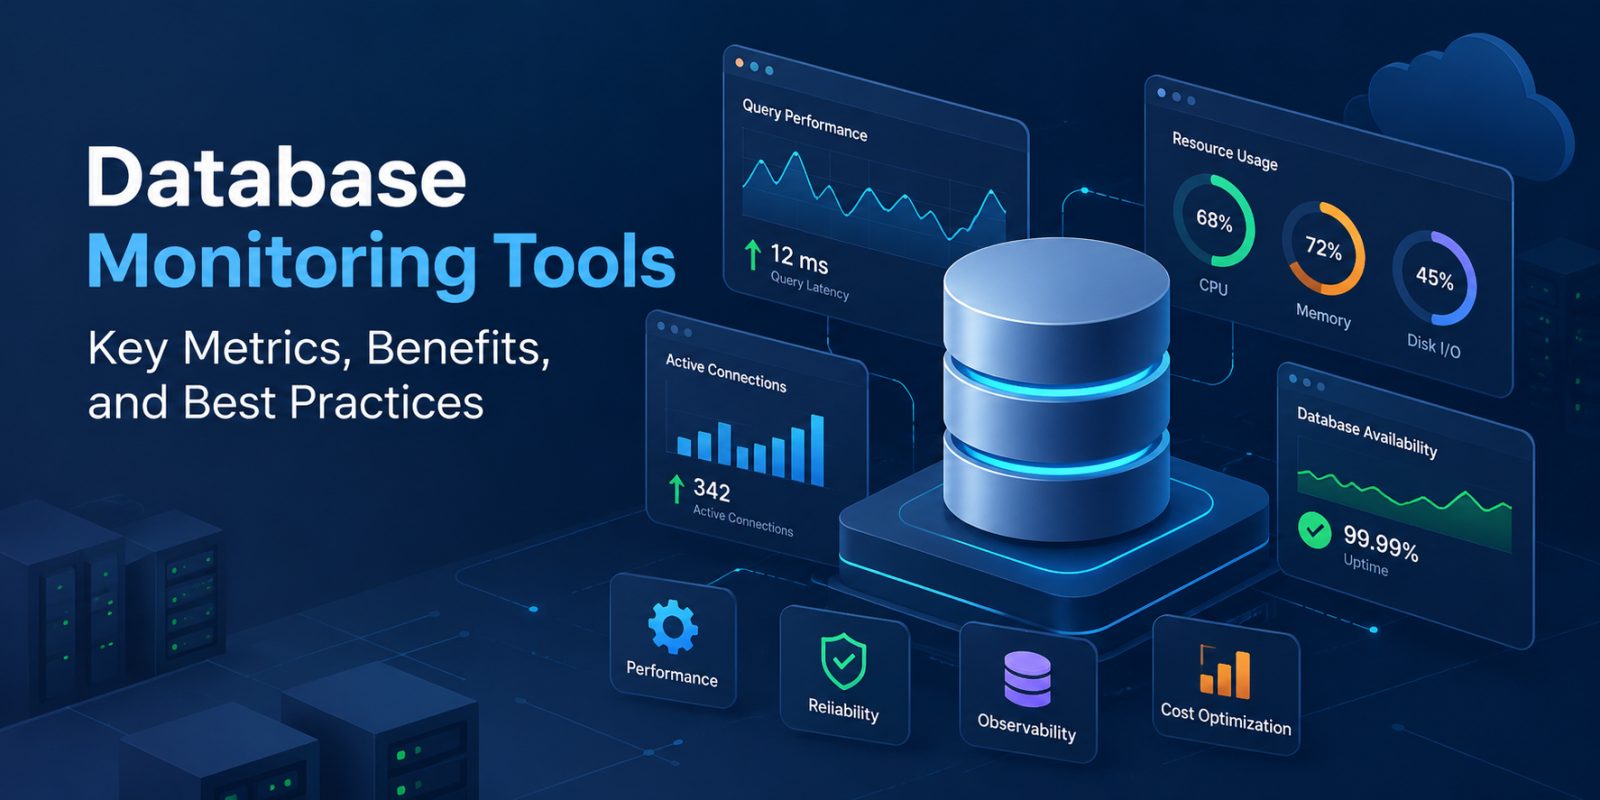
Databases power modern applications, storing everything from customer transactions to business-critical operational data. When database performance declines, applications may slow down, queries can time out, and users may experience service interruptions. Without proper monitoring, these problems can remain undetected until they affect business operations.
Database monitoring tools help organizations track database health, performance, and availability in real time. By collecting metrics such as query latency, CPU usage, memory consumption, and connection counts, these tools help database administrators and DevOps teams identify potential issues before they escalate.
Modern observability tools extend this visibility by helping teams analyze performance trends, investigate bottlenecks, and make informed infrastructure decisions.
What Is Database Monitoring?
Database monitoring is the continuous process of collecting, measuring, and analyzing database performance and health metrics to maintain availability, reliability, and efficiency.
It helps database administrators (DBAs), site reliability engineers (SREs), and IT teams understand how databases behave under different workloads.
Database performance monitoring typically involves tracking resource utilization, query execution, active connections, storage capacity, and system errors.
For organizations managing complex applications, database observability provides deeper insight into why performance problems occur. Rather than simply indicating that a database is running slowly, observability connects relevant metrics, logs, and application behavior to support root cause analysis.
How Do Database Monitoring Tools Work?
Database monitoring tools collect operational information from database engines, operating systems, and supporting infrastructure. They transform this data into measurable indicators that teams can analyze through dashboards and alerts.
The monitoring process generally includes four stages.
1. Metrics Collection
Monitoring agents, exporters, or native database integrations collect performance metrics such as query duration, connection usage, transaction rates, and resource consumption.
2. Metrics Storage
Collected measurements are stored for analysis over time. A scalable time series database can help organizations retain and query large volumes of timestamped performance data.
3. Visualization and Analysis
Dashboards display database health indicators and historical trends, allowing engineers to identify unusual patterns, capacity constraints, and recurring performance problems.
4. Alerting and Troubleshooting
Alerting systems notify teams when important metrics exceed defined thresholds or indicate abnormal conditions. Engineers can then investigate the issue and take corrective action.
This combination of monitoring and analysis supports faster incident detection and more reliable database operations.
Key Database Monitoring Metrics to Track
Effective database monitoring starts with identifying metrics that reflect actual system performance and user experience.
|
Monitoring Metric |
What It Measures |
Why It Matters |
|
CPU utilization |
Processor resources consumed |
Identifies resource pressure |
|
Memory usage |
Memory consumption and pressure |
Helps detect memory-related bottlenecks |
|
Query execution time |
Time required to process queries |
Reveals slow database operations |
|
Active connections |
Number of open database connections |
Helps prevent connection exhaustion |
|
Disk I/O |
Storage read/write activity and latency |
Identifies storage bottlenecks |
|
Transaction throughput |
Transactions processed over time |
Measures workload and capacity |
|
Replication lag |
Delay between primary and replica updates |
Indicates replication health |
|
Database availability |
Whether the database responds successfully |
Helps detect service disruptions |
These metrics should be evaluated together. For example, rising query latency alongside increased disk I/O latency may indicate storage contention rather than insufficient CPU capacity.
Benefits of Database Monitoring Tools
Early Detection of Performance Problems
Continuous monitoring helps teams recognize abnormal performance patterns before they become major incidents. Query slowdowns, connection spikes, and excessive resource usage can trigger investigations before widespread service degradation occurs.
Improved Database Reliability
Monitoring supports more stable database operations by identifying recurring failures, resource limitations, and potentially unhealthy workloads.
For organizations operating mission-critical systems, enterprise monitoring can provide additional capabilities such as expert technical guidance, architectural support, and advanced observability features.
Faster Root Cause Analysis
Database performance issues can originate from inefficient queries, infrastructure constraints, application changes, or unexpected workload increases.
Correlating performance metrics with logs and application telemetry helps engineers narrow down possible causes and reduce troubleshooting time.
Better Capacity Planning
Historical monitoring data shows how workloads evolve over time. Teams can use these trends to estimate future storage, processing, and memory requirements.
This helps organizations plan infrastructure upgrades before capacity limits affect application performance.
Reduced Operational Costs
Effective monitoring helps identify underutilized resources, unnecessary infrastructure spending, and inefficient workloads.
By understanding actual usage patterns, organizations can make better decisions about resource allocation and scaling.
Database Monitoring Tools vs. Database Observability
Although database monitoring and database observability are closely related, they serve different purposes.
Database monitoring focuses on tracking predefined metrics and identifying known performance conditions.
Database observability provides broader context to investigate unexpected behavior and understand why problems occur.
For example, a monitoring dashboard might show that query latency has increased. An observability workflow could help engineers correlate that increase with application traces, database logs, and infrastructure metrics.
Modern observability software helps organizations build this broader visibility across applications, databases, and infrastructure.
Both approaches are valuable. Monitoring identifies symptoms, while observability supports deeper investigation.
Database Monitoring Best Practices
Establish Performance Baselines
Measure normal database behavior during different workload conditions, including peak and off-peak periods.
Historical baselines help distinguish unusual behavior from expected variations.
Monitor Critical Metrics First
Prioritize database availability, query latency, resource utilization, connection saturation, and storage performance.
Choose additional metrics based on the database engine, application requirements, and operational risks.
Configure Actionable Alerts
Avoid creating alerts for every minor fluctuation. Instead, define thresholds and conditions associated with meaningful performance degradation.
Alerts should provide enough context for engineers to understand the issue and determine an appropriate response.
Use Scalable Monitoring Infrastructure
As databases and applications grow, monitoring platforms must manage increasing volumes of metrics without introducing unnecessary operational complexity.
Solutions built around an open source time series database can help teams store and analyze infrastructure metrics while retaining control over their deployments.
Monitor the Monitoring System
Database monitoring is only useful when the monitoring infrastructure itself remains operational.
If metric collection, storage, or alert delivery fails, database problems may go unnoticed.
VictoriaMetrics offers a dedicated monitoring solution called Monitoring of Monitoring (MoM). This service monitors VictoriaMetrics components, identifies potential monitoring issues, and provides expert guidance to improve reliability.
It adds an additional layer of protection against silent failures in the monitoring infrastructure.
How VictoriaMetrics Supports Database Monitoring
VictoriaMetrics provides scalable infrastructure for storing, querying, and analyzing time series metrics.
Organizations can collect database performance metrics through compatible exporters and integrations, then use VictoriaMetrics as a metrics backend for monitoring and analysis.
Its open source monitoring capabilities support organizations building monitoring environments for databases, applications, and infrastructure.
For more demanding workloads, VictoriaMetrics Enterprise provides additional monitoring capabilities and engineering support, while its cloud offering supports managed observability deployments.
VictoriaMetrics primarily serves as a metrics storage and observability platform. Database-specific instrumentation, query-level diagnostics, and activity auditing may require additional exporters or specialized tools.
Frequently Asked Questions About Database Monitoring
What are database monitoring tools?
Database monitoring tools are software solutions that track database availability, performance, and resource usage. They help teams identify slow queries, connection problems, storage bottlenecks, and other operational issues.
What is the difference between database monitoring and database activity monitoring?
Database monitoring focuses primarily on performance, availability, and system health. Database activity monitoring tools focus on tracking database access and operations, often for security auditing, compliance, and suspicious activity detection.
Can database monitoring tools monitor SQL Server?
Yes. SQL Server database monitoring tools can track query performance, blocking, deadlocks, resource usage, and other SQL Server-specific metrics. The available capabilities depend on the selected monitoring platform and integrations.
Why is database observability important?
Database observability helps engineers investigate performance issues using metrics, logs, and related telemetry. It provides context beyond basic health indicators and supports more effective troubleshooting.
How often should database performance be monitored?
Production databases generally benefit from continuous monitoring. The appropriate collection interval and alerting thresholds depend on workload patterns, system criticality, and infrastructure requirements.
Conclusion
Database monitoring tools play an essential role in maintaining database performance, reliability, and availability. By tracking critical metrics, establishing performance baselines, and configuring actionable alerts, organizations can detect problems earlier and troubleshoot them more effectively.
Combining database performance monitoring with broader observability gives engineering teams better visibility into system behavior and infrastructure health.
For organizations seeking scalable metrics storage and monitoring infrastructure, VictoriaMetrics provides open-source, enterprise, and managed options to support evolving observability requirements.